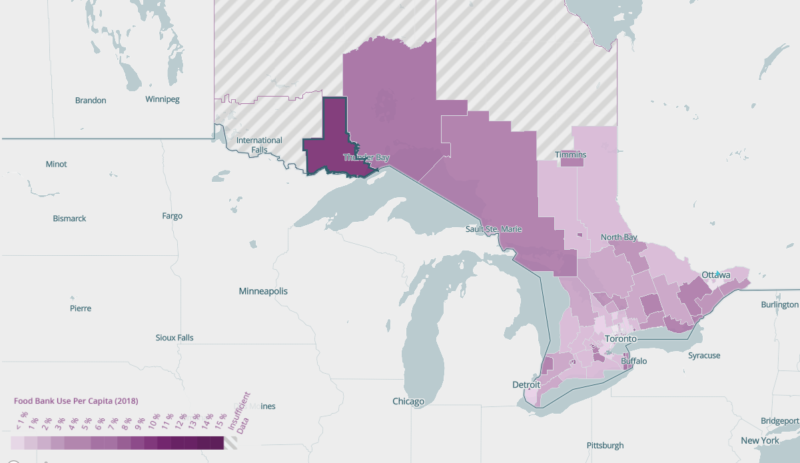
About the Map
Feed Ontario’s new study reveals that hunger and food bank use exist in every electoral riding in Ontario. The study, which examines food bank use data between January 1st – December 31st 2018, also reveals that Ontario’s food banks were accessed by 507,977 people who visited 3,033,970 times throughout the year – a three percent increase over 2017.
The study was completed in partnership with the Fleming College Geographic Information Systems (GIS) program and presents the findings
on an interactive map that allows users to compare provincial electoral ridings across the province, including information on food bank use, mean and median income, and housing. The intention of the project is to help inform visitors to the website that hunger and poverty touch every corner of the province.
Food Bank Use by Provincial Electoral Riding (2018)
The data below highlights the top 10 provincial electoral ridings with the highest per capita concentration of food bank use in Ontario in 2018.
Some important notes about the numbers:
- Food bank catchment areas do not align with electoral riding boundaries. As a result, many food banks serve multiple electoral ridings, and equally many electoral ridings may be served by multiple food banks. The numbers below alone should not be attributed to the service of any one particular food bank.
- This study only includes food bank use data from Feed Ontario member food banks.
- This map only represents the individuals that provided their residential postal code when they visited a Feed Ontario member food bank. Food bank use is 12-14% higher than what is represented on the map.
| Provincial Electoral Riding |
Food Bank Use Per Capita |
Total Number of Unique Individuals |
Total Number of Visits |
| Ottawa–Vanier | 15 in 100 | 16,537 | 80,332 |
| Hamilton Centre | 12 in 100 | 12,300 | 111,828 |
| Thunder Bay–Atikokan | 11 in 100 | 8,276 | 27,488 |
| Kitchener Centre | 10 in 100 | 10,411 | 72,825 |
| Ottawa South | 9 in 100 | 10,533 | 53,824 |
| Windsor West | 9 in 100 | 10,564 | 64,065 |
| London–Fanshawe | 8 in 100 | 9,959 | 45,348 |
| Windsor–Tecumseh | 8 in 100 | 8,860 | 51,543 |
| Ottawa West–Nepean | 8 in 100 | 8,480 | 45,145 |
| London North Centre | 7 in 100 | 8,383 | 34,765 |
The interactive map was created by students of Fleming College post-graduate Geographic Information Systems Specialist program, Jordan Sparrow and Nihal Garach.
Learn more about the project’s methodology. Link opens a new window
Get Involved
You can help #FeedChange and support people in need across Ontario!
How Can I Participate?
- Contact: Call, email, or visit your MPP and share our map and recommendations for change with them.
- Social Media: Share our map and tag us + your MPP on Twitter Link opens a new window or Facebook Link opens a new window!
Who Should I Contact?
- Your Own MPP: Find your riding and MPP’s contact information at Elections Ontario Link opens a new window.
- Other Key MPPs: Premier Doug Ford (@FordNation Link opens a new window), Minister of Children, Community and Social Services, Todd Smith (@ToddSmithPC Link opens a new window), and the Parliamentary Assistant responsible for Community and Social Services, Jeremy Roberts (@JR_Ottawa Link opens a new window)
Learn More
Feed Ontario and the provincial food bank network have long-advocated for long-term solutions that address the root causes of hunger, including social assistance reform, increased access to affordable housing, and creating secure, well-paying employment opportunities.
Our current recommendations for change include:
- Retain ODSP’s current definition of ‘disability’, ensuring that it is inclusive of episodic illness
- Reduce the clawbacks on earned income under Ontario Works and ODSP from 75% to 50% for individuals trying to re-enter the workforce
- Continue moving forward with Bill 60 Link opens a new window, which will establish a social assistance research commission to advise on evidence-based rates and policy directives
With the Government of Ontario’s focus on finding efficiencies and cost savings, investing in poverty reduction is a smart choice, as poverty costs the government an estimated $13.1 billion a year Link opens a new window ($15.8 billion when indexed to inflation), due to factors such as increased health costs Link opens a new window and lost productivity.
Learn more about our recommendations for change.